
A night-sky photograph can look like a frozen landscape, yet stars brighten and fade while asteroids move among background stars. Understanding the Universe requires repeated records of the same place as well as a beautiful single picture. The public alerts that Vera C. Rubin Observatory in Chile began issuing in 2026 share observations of these changes. Using official material checked on 25 October 2026, this article treats the news as an opportunity to practice reading data and reasoning scientifically.
1. What 800,000 alerts mean
Rubin Observatory announced on 25 February 2026 that it had issued roughly 800,000 first public scientific alerts on the previous night. An alert communicates data about a detected candidate change in the observed sky; it does not mean that the identities of that many new celestial objects have been established. A known variable star brightening again, or the same object being detected in another observation, can produce further records. Distinguish the number of alerts, the number of distinct objects and the number of confirmed new discoveries.
The announcement’s expectation of eventually reaching up to about seven million alerts per night was a projection, rather than the first night’s result or a daily guaranteed throughput. The official early-science guide also explains that the scope of alert production depends on where reference images are available. The date of the first alerts therefore cannot be read as the date when every change across the whole sky became publicly available. Operating schedules and the data actually provided can change. For research or lessons, record both the observation date and the date when you checked the release guidance.
2. What remains when pictures are subtracted?
A key tool for finding changes is the difference image. Comparing a new exposure with a reference image of the same region reduces the steady background and leaves changed features. Real processing, however, is more involved than simply subtracting the pixel values of two photographs. Star positions must be aligned, while brightness calibration and the shapes of stars blurred by the atmosphere must be accounted for. These steps make the comparison meaningful. They also help prevent residuals around a misaligned star from being mistaken for a new celestial object.
For a learning activity, photograph the same desk twice. Move only one pencil in the second picture, keeping the camera and lighting as consistent as possible, and mark the differences. Next, move the camera too. Many differences appear even though only one object moved. This is an analogy about comparison conditions, not an experiment reproducing astronomical instruments. The essential distinction is between detecting a difference and deciding that the difference has an astronomical cause: those are separate judgments.
3. Read a history, rather than a single point
A light curve places measurements of an object’s brightness in time order. Two measurements may show only that it brightened. A longer record lets us ask whether the behavior repeats or rises rapidly and fades slowly. Check whether the horizontal axis represents actual time or simply the order of observations. Drawing a week-long gap and a few-minute gap at the same width changes the impression of how quickly things happened. Read the uncertainties around measurements and the observing filters alongside the plotted points.
In a magnitude graph, remember the convention that smaller numbers indicate brighter objects. On a flux axis, describing the amount of light, a larger value generally means greater brightness. Casually connecting points from different filters into one line can confuse wavelength differences with changes over time. A missing point also does not mean the object disappeared. There may have been no observation, or clouds or sensitivity limits may have prevented a measurement. Resisting the temptation to fill empty intervals with imagined events is part of interpreting data.
4. How do brokers organize alerts?
People cannot read every alert individually. Rubin’s data brokers are software systems that receive alerts, compare them with existing catalogs, filter by selected conditions and help prioritize follow-up observations. Services linked in the official guide, including ALeRCE, ANTARES, Fink and Lasair, perform these roles. The classifications shown in a web interface may combine measurements with algorithmic estimates. A label such as supernova candidate gives a reason to investigate; the label alone does not conclusively establish the object’s type.
Classification probabilities must also be interpreted in the context of the model and its input data. Instead of assuming that high scores from different services imply the same accuracy, check their observation histories and classification schemes. A filter good at selecting bright, well-observed objects may miss faint or unfamiliar changes. Think of an email folder: organizing messages reduces the number to inspect, but an empty folder does not prove the original messages never existed. Record the filter’s purpose and exclusion conditions so that its results can be explained.
5. How a candidate becomes a discovery
After finding an interesting residual, first compare the original exposure with the reference at the same position and check earlier observations for similar problems. Residuals near bright stars or processing artifacts can resemble real astronomical changes. Then examine detections at other times alongside existing catalogs. For a moving object, linking positions over time matters; distinguishing kinds of explosive events may benefit from additional observations such as spectra from another telescope, as well as brightness changes. The checks needed depend on the question being asked.
The speed of delivering an alert is therefore different from the speed of reaching a scientific conclusion. Fast sharing helps other instruments observe information that may soon become inaccessible. Combining a candidate record, preliminary classification, follow-up and confirmed result into a single step makes research look simpler than it is. Rather than focusing on inflated discovery totals, ask which observations were added and how alternative explanations were narrowed down. Revising a conclusion is not merely failure; updating a judgment as evidence accumulates is normal scientific work.
6. An evidence notebook students can make
For a class or independent study, choose one public example from a broker linked by the official site and make an evidence notebook. Begin with the data address, object identifier, observation time and date of access. Then put facts read directly from the interface in one column and possible explanations in another. For example, separate the observation that brightness differed between two measurements from the interpretation that the object could be a supernova. Record missing observations too. This turns vague uncertainty into a clear account of which information is still needed.
It is useful for two people to read the same example independently and compare notes. One can focus on graph axes and uncertainties, the other on observation intervals and the basis of the classification, before exchanging explanations. Seeing a public page does not justify reporting a discovery under your own name or spreading unverified danger warnings. Check whether the interface shows current operational data or a historical example. The aim is not to beat specialists to the answer, but to leave a connection between observation and inference that somebody else can follow.
7. Reading photographs alongside current news
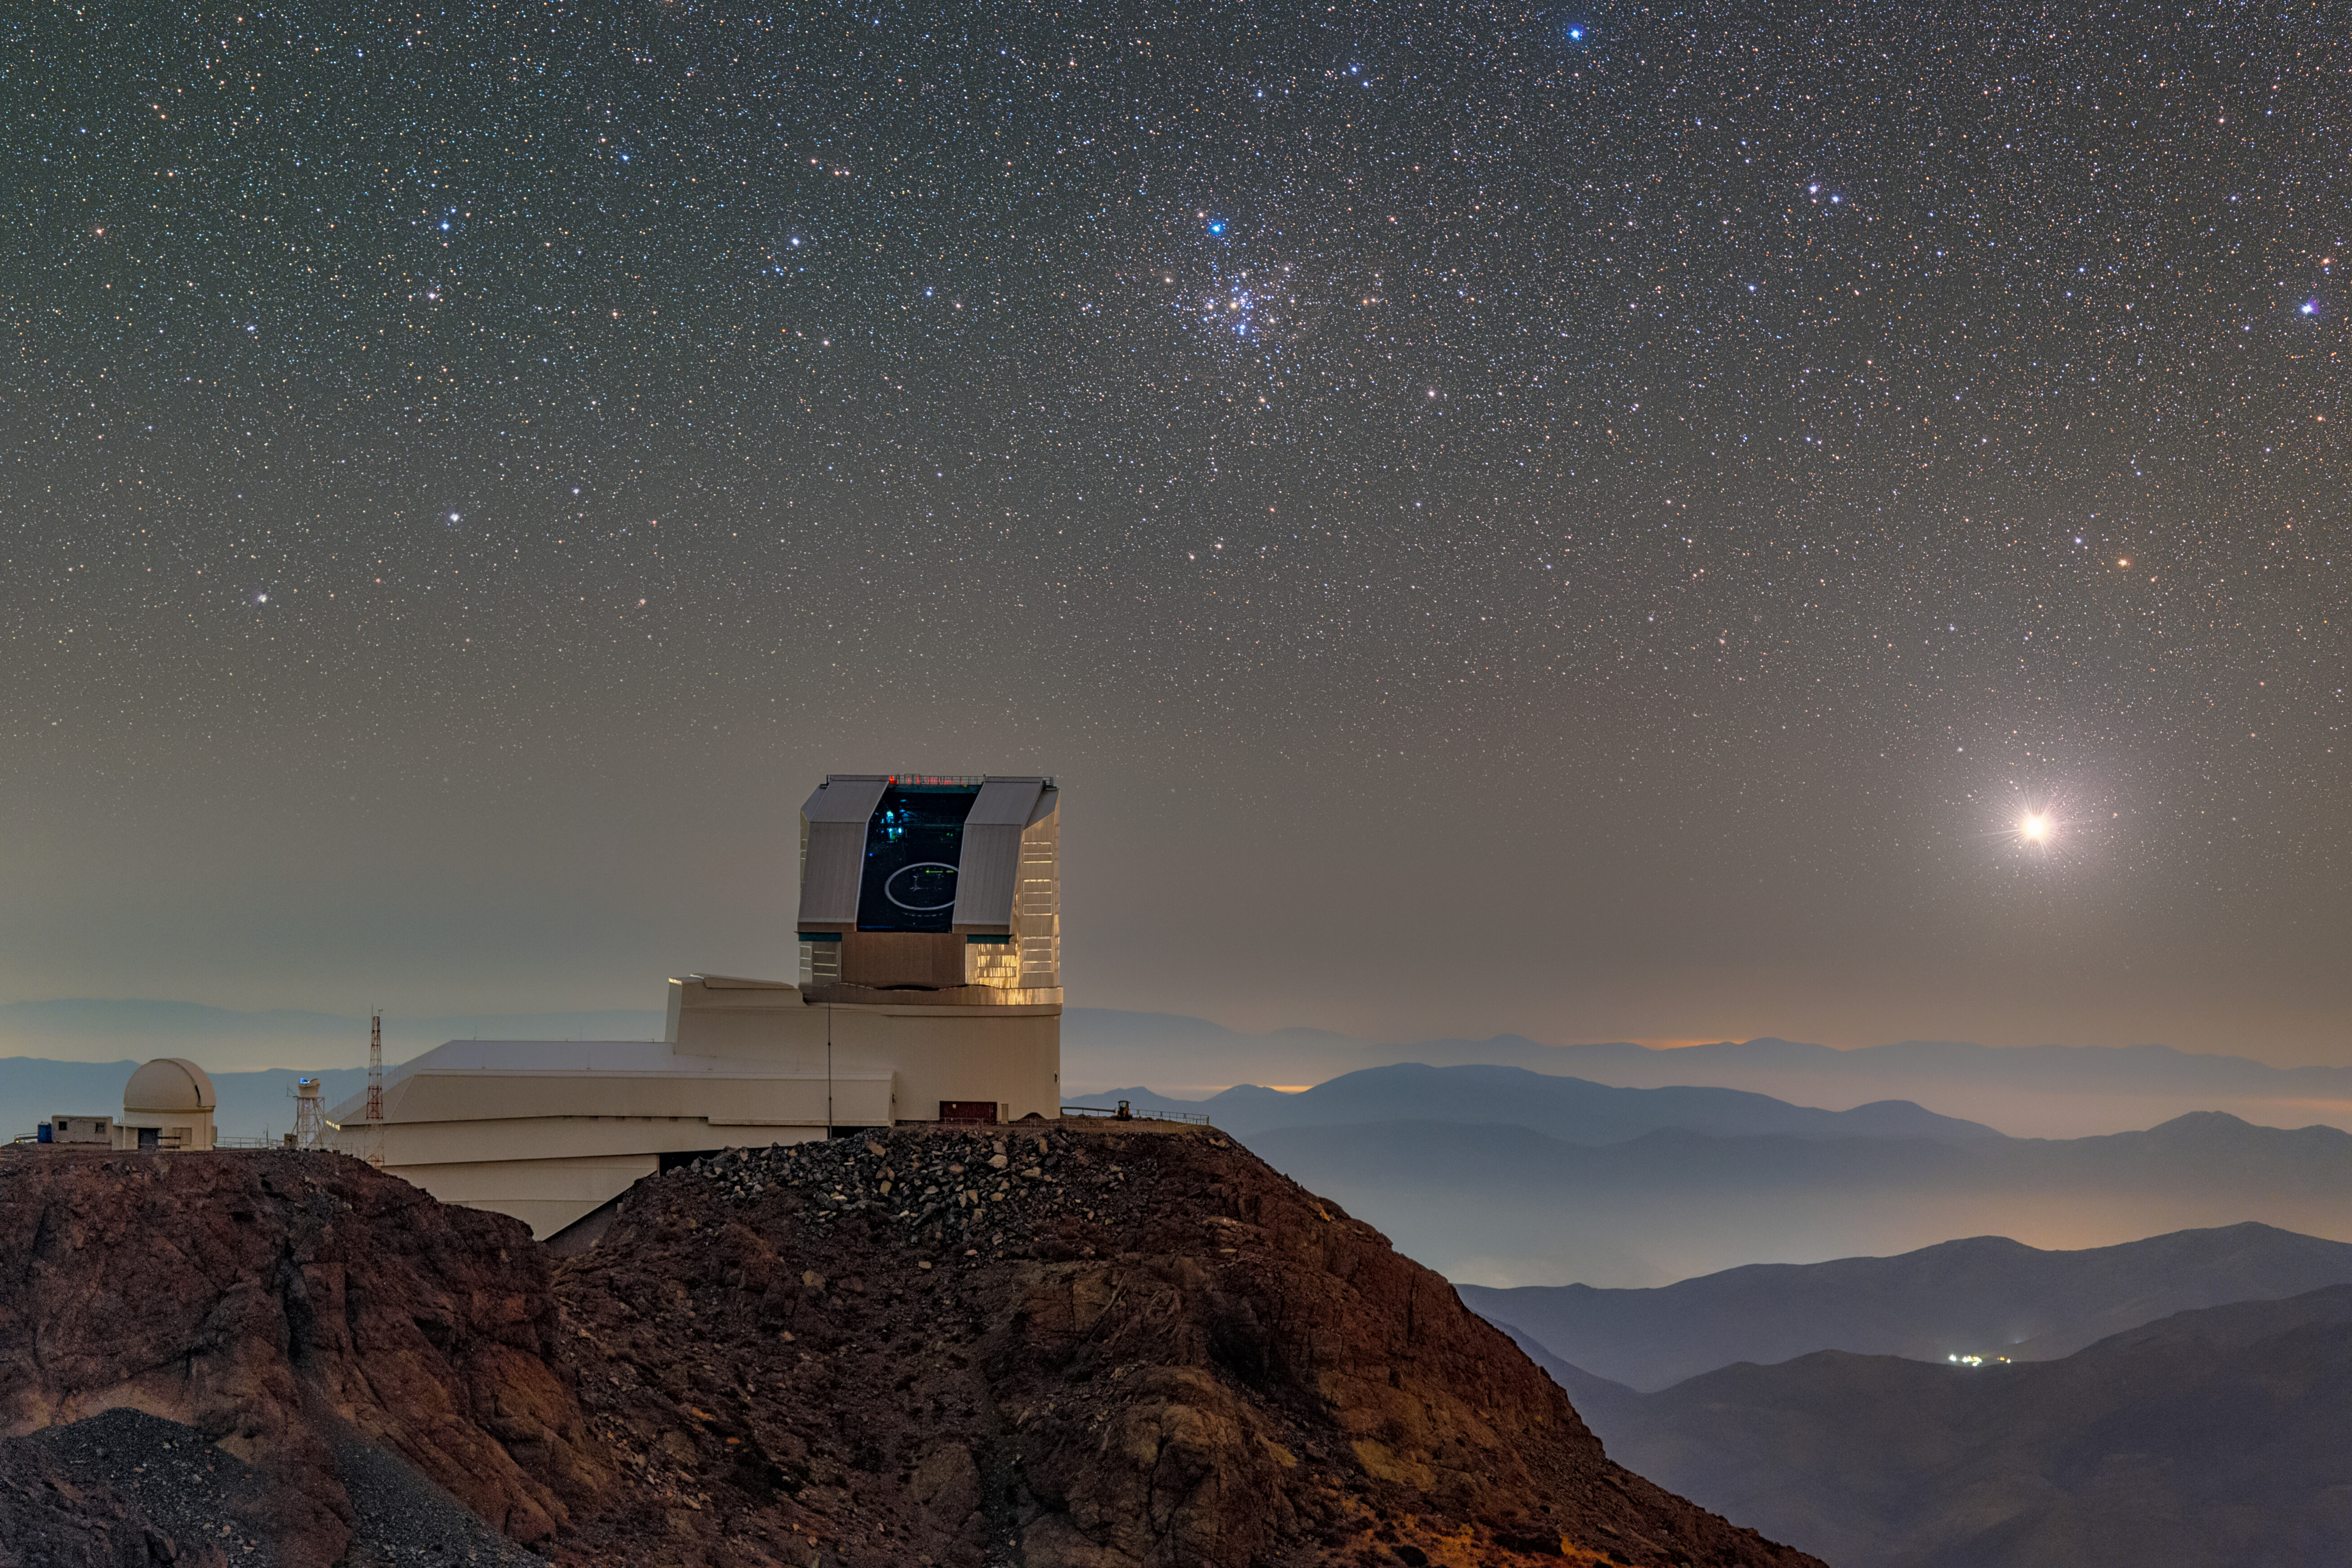
The photograph in this article shows Rubin Observatory’s observing facilities in Chile. It is not a picture of an object from a particular alert, nor a scene of a supernova exploding. A facility photograph helps explain where the observations originate and what equipment produces them. Evidence about a particular celestial object must instead come from its observation images and measurement records. When viewing a striking space photograph, check whether it is an observation, a composite or an explanatory illustration. This makes it easier to judge which claims the image actually supports.
Rubin’s alerts are interesting for more than their large numbers. They show repeated observations, public data, automatic classification and follow-up verification working through a question together. When reading new findings, first ask when the observations were made, what they were compared with, what was measured and what remains an estimate. Distinguish the first-alert announcement from the service’s present status too. These habits extend beyond astronomy: they can help us assess AI outputs and charts in science news without reaching conclusions ahead of the evidence.