
1. Start with the yellow fan and curved stripes
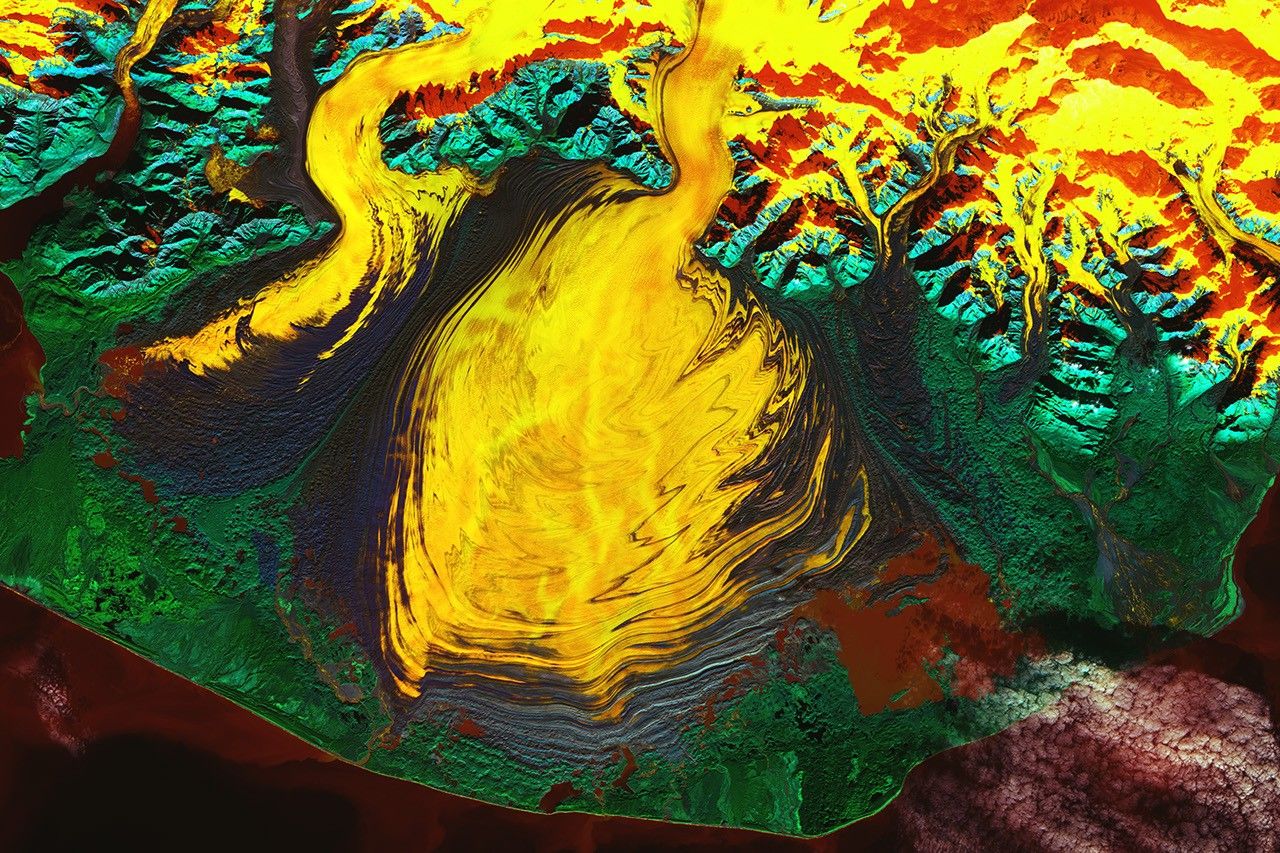
A broad yellow mass spreads across the centre of the main image, with several dark bands curving around its edges. Ice descending through narrow mountain valleys above spreads onto wider terrain below. This is Malaspina Glacier in southeastern Alaska. The image is a color composite of data collected by Landsat 9’s OLI-2 instrument on October 27, 2023, rather than a photograph reproducing the colors seen by an observer on the ground. Knowing the observation date and how the colors were made helps make these unfamiliar patterns much easier to read accurately.
First, follow the bright ice and the dark bands within it separately. Bands loop widely along the edge of the broad central ice, while pronounced zigzag folds appear in the section descending from the upper right. The turquoise mountains around it and green terrain below are also distinguishable. These are not decorative colors painted onto the same material: different surface reflectance properties and the actual terrain appear together. Seeing that a line bends, however, is separate from explaining how that line formed.
2. Yellow ice does not mean warm ice
Satellite instruments record light coming from the surface in different wavelength bands. This image combines Landsat bands 1, 5, and 7. Band 1 is the coastal/aerosol band at the short-wavelength end of visible light, band 5 is near-infrared, and band 7 is shortwave infrared. Because information from wavelengths invisible to human eyes is also assigned display colors, this is called a false-color image. Here, “false” means that the displayed colors differ from everyday natural-color vision, not that the terrain is fictitious.
In this combination, terrain containing ice and water appears in reds, oranges, and yellows, vegetation in green, and rock in blue tones. The central yellow ice must be read within this display scheme. The three bands used here differ from thermal-infrared temperature-observation bands, so yellow or red cannot directly be interpreted as evidence of high temperature. In glacier images made with other band combinations, the same ice may appear blue. Before comparing colors, check that the instrument and band combination are the same.
3. Solid ice also flows under gravity
Glaciers move under gravity while remaining frozen. Ice deforms internally under sufficient stress, and, depending on conditions, its base can also slide over the ground. It does not have to melt entirely into water before moving. Mountain valleys constrain its path, but ice can spread sideways when it reaches broad terrain beyond a valley. This form, where a broad ice mass spreads at the foot of mountains, is called a piedmont glacier. Malaspina provides a clear example.
The main image also lets us connect the narrow ice passage above with the expanded area in the centre. Mountain ice feeds Malaspina through glaciers including Seward Glacier, and several flows merge on the coastal plain. Treating the broad fan-shaped area as an independent ice lake therefore misses the reason for its form. A still image, however, does not play back the movement of the ice. The overall shape shows a relationship between terrain and flow, but how far a particular point moved in a day must be measured separately.
4. Dark lines are bands of rock and soil carried by ice
The deep blue to purple lines visible on the ice surface and along its edges are moraine bands. They consist of rock, soil, and other debris carried together as the glacier moves. Debris along the sides of glaciers can continue into the interior of the new flow where two ice streams merge. Dark bands therefore do not occur only at the outer edge. Lines extending inward along merging streams offer clues about where the ice came from.
Unlike tree rings, one band does not necessarily represent one year, and not every dark line should be read as a crack in the ice. Debris bands and ice fractures form through different processes. In the main image, focus on the curved shapes of long debris bands among the bright ice. First identify the curves actually visible, then connect them to the geological explanation of moraines to avoid confusing what the image shows with its interpretation.
5. A surge is a change in speed, not a guarantee of glacier growth
Some glaciers in this region undergo surges, moving faster than usual. Periods of rapid flow can last from a year to several years, and these irregular movements can fold, compress, and offset debris bands. The complex zigzags and large bends visible at Malaspina relate to that flow history. Moraine bands are traces that move and deform with the ice, rather than fixed map lines laid on top of it.
An account of a surge must not be turned into a claim that the glacier’s total ice volume increased. Flow speed, advance or retreat of the glacier’s end, and the amounts of ice gained through snowfall and lost through melting are different things to observe. Rapid movement can also occur in a retreating glacier. Nor do the curved bands in this 2023 image alone establish that a surge was underway on the observation date or reveal an exact speed. Observations from different dates are needed to discuss current movement.
6. From one pattern to observations over time
To calculate movement speed, compare how far the same feature has shifted in images from different dates with aligned locations, and account for the intervening time. Tracking surface features such as moraine patterns helps researchers study ice flow. Snow cover, clouds, and changing observation conditions can alter the appearance of the same place, so a color change alone cannot be converted into a movement distance. Distinguishing changes in color from changes in position is the starting point for observations over time.
Look again at the main image, finding in turn the shape connecting the mountains to the broad ice mass, the folded dark bands within bright ice, and the colors contrasting with surrounding surfaces. Shape gives clues to a piedmont glacier’s structure, debris bands to transport and deformation, and colors to the selected wavelength bands. This article’s image is an observation made from actual satellite data, rather than an imagined explanatory illustration or natural-color photograph. Reading this landscape means understanding the spatial features visible in one image and checking speed and long-term change with observations from multiple dates.